Getting Fat
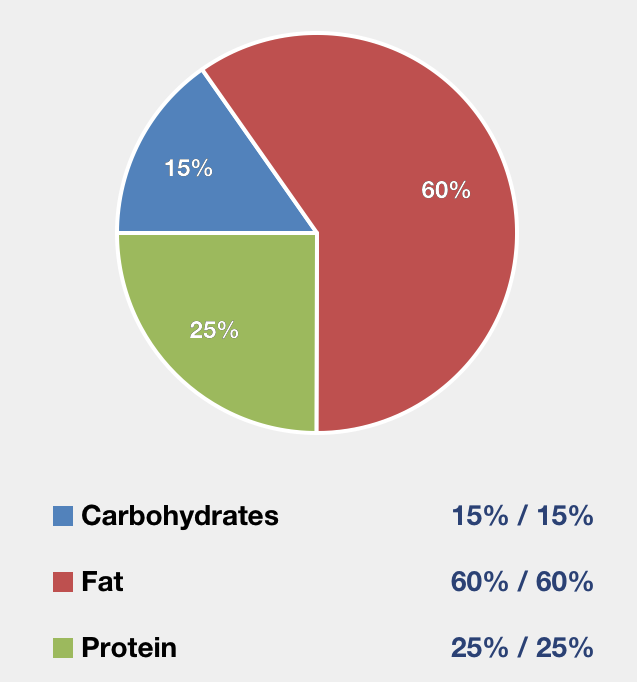 Note: 60/25/15 are the ratios that worked best for me during a 90 day fat loss focus that resulted in nearly 14 pounds of body fat lost with a 5 pound gain in lean mass. That DOES NOT mean those ratios are best for you. The premise of what I'm calling the "Pie Diet" is to draw your attention to where calories are coming from and away from simply the calorie totals. I have seen many colleagues and patients thrive on 60/25/15, losing fat as I did, but you may need to adjust. My suggestion is start at 60/25/15 and track progress. I suspect many folks (particularly those start with excess body fat and insulin resistance) would do better with a more enhanced fat/carb ratio, like 70/25/5 for a period of time and those with auto-immune issues may need to lower protein.
The bottom line: There is no one diet that fits all and their never will be. But an essential starting point is knowing what fuel is going in and make adjustments to this as necessary.
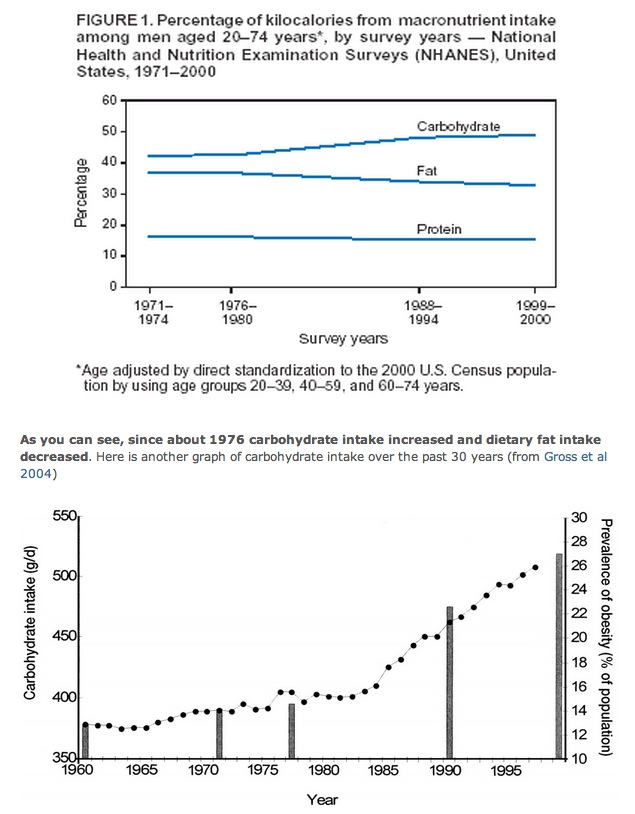
The most common question I have gotten since launching the recent fat loss transformation is, "Where did all of that fat intake come from?" The second question generally relates to how incredibly counter to any conventional (and even integrative) dietary recommendation this philosophy is and is that safe for the heart and cancer risk. This has been an incredible and on-going journey where I have spent countless hours reviewing literature and data on nutrition along with the history of dietary recommendations and how we got so incredibly off the path. The most eye opening resource I came across is Gary Taubes' book Good Calories, Bad Calories. It's an amazing story of the history of nutrition recommendations and a review of the research as it stands. In it, he shows the lack of data for following a low fat diet and how doing so will actually increase the risk of obesity, insulin resistance and heart disease. Certainly the American health (or lack thereof) data would agree:
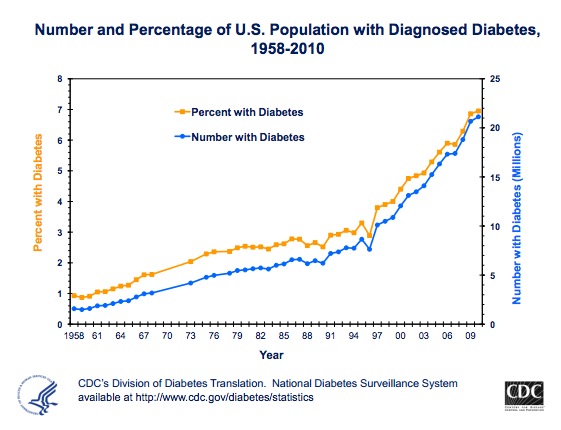
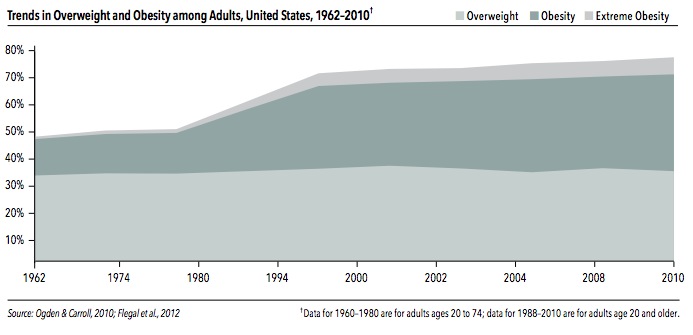
What's interesting is that the graphs above show that American's did a great job of listening. The low fat recommendations came out in the 1970s, the exact time frame on the graphs when things really started to spike. When a person cuts something from their diet, it has to be replaced. In this case, carbs took the place of fats and the storage of fat and resistance to insulin began.
So maybe cutting fat is not the answer. Or is it the type of fat that matter?
Here are some graphs from the USDA, ERS Food Availability Data System.
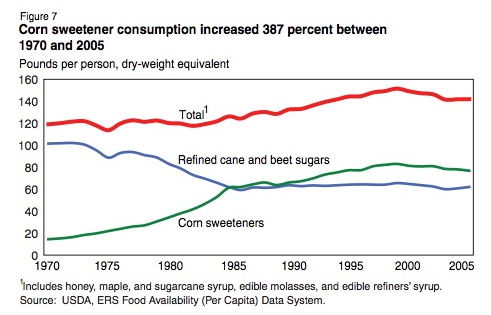
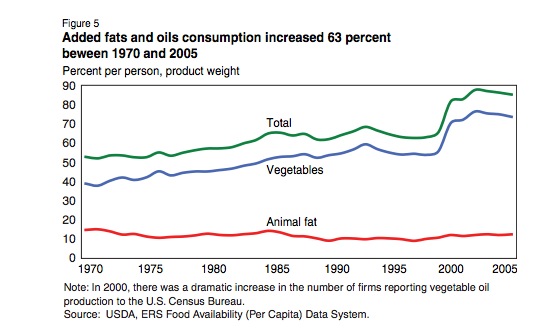
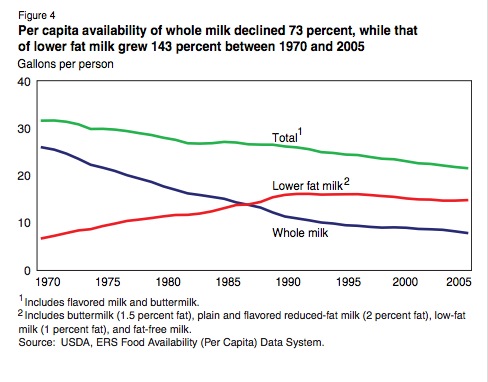
So how did the American diet change from 1970 to current day?
- Increased consumption of total sweetener, with a higher percentage of said sweetener coming from corn.
- A decrease in animal fat consumption and 63% increase in vegetable oils.
- Swapping out whole milk for lower fat milk.
What happened to America's pie chart? Let's use some graphs from a blog post by Photo Calorie:
1970  2000
2000
We have continued to increase carbohydrate intake in the face of lowering fat intake as well as a slight decrease in protein intake. Maybe just as importantly, our fat intake changed from animal sources to a big jump in vegetable oils (ultimately an increase in the omega 6:omega 3 ratio, more on this in the future).
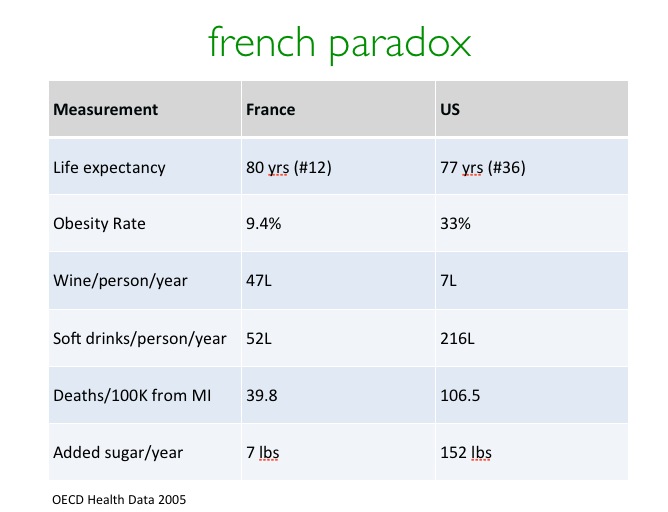
Remember the French Paradox? In the 80s and 90s the gap between America's un-health and the incredibly lower rates of obesity and heart disease in France was widening. The French were eating significantly higher amounts of saturated fats (butter and meat as primary sources) and drinking red wine yet were winning the health challenge. Many thought it must be the red wine, because there is no way eating saturated fat could be good for you. Clearly the amount of sugar intake between our two countries is tremendous and therefore the levels of health.
An interesting study was done following the French dietary habits from 1995-2002. They followed nearly 13,000 middle-aged men and women and tracked their dietary habits. Apparently, their desire to be like us permeated their nutrition, as they dramatically decreased their percent of fat in their diet, decreased animal products while increasing their fruit and vegetable intake (carbs). Fiber, protein and alcohol intake remained stable. This should have given them an even greater health advantage, especially since they continued their red wine consumption, right?
The data tells another story:
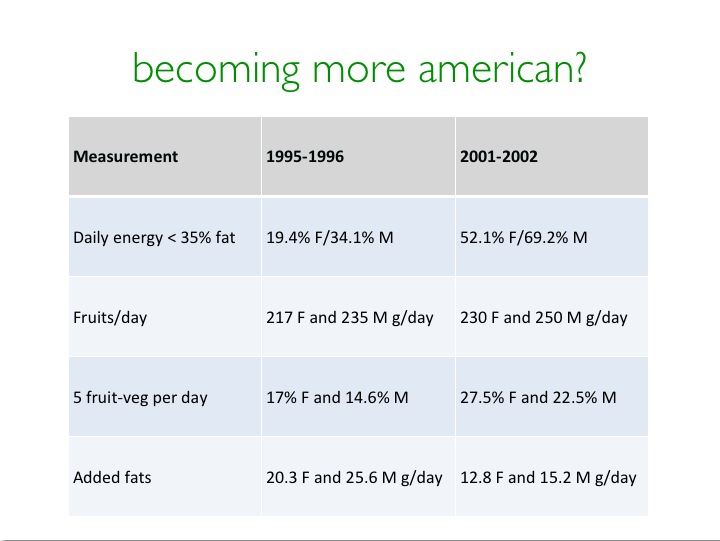
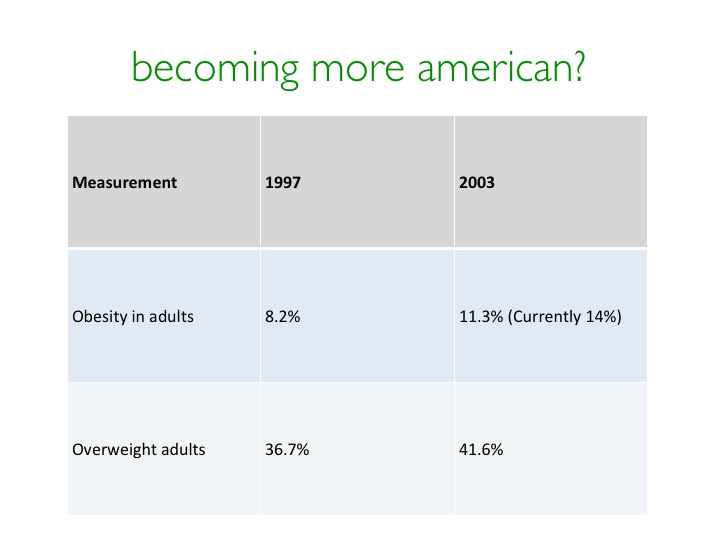
So as they decrease their animal product intake (like us), decrease their overall fat intake (like us) and increase their carbohydrate intake (more fruits/vegetables and if they kept protein the same and dropped fat, guess what replaced it, like us); they start looking like us.
So cutting fat does not seem to be the cure-all we thought. What about increasing fat, should we worry about that? Watch a portion of this lecture from the President and CEO of the Memorial Sloan-Kettering Cancer Center, a major conventional cancer center in the US. Forward to the 27:00 mark and watch through 28:06 as he discusses macronutrients and cancer risk. Video is embedded at the bottom of this post for convenience.
What about heart disease? The American Journal of Clinical Nutrition published this meta-analysis of 21 studies, following over 300,000 patients to determine the link between lowering saturated fat and improved cardiovascular health. Their conclusion:
"A meta-analysis of prospective epidemiologic studies showed that there is no significant evidence or concluding that dietary saturated fat is associated with an increased irsk of coronary heart disease or cardiovascular disease."
So, if cutting fat intake, particularly from saturated and animal sources increases obesity, insulin resistance and their related metabolic catastrophies, then adding it back should be therapeutic, right? We have good evidence to support the fact that dietary fat does not make us fat and this is a major flaw in the conventional dietary advice. People have been brainwashed with bad data and its time we started looking for light.